5 min read
10 Key Metrics to Measure User Engagement in Mobile Apps
Anurag : Apr 10, 2017 12:00:00 AM


For a mobile app to be a success, not just clicks or ratings or measuring app downloads is sufficient, but it's important that the app’s main value proposition is well understood by the users. There is no one-miracle-metric to measure engagement though, the purpose of the app, outcomes, and goals should be well clear to determine the right metrics for your mobile app.
As brands are starting to develop their mobile presence and hope to meet user requirements, creating an engaging user experience is becoming a prerequisite for them. Building apps and looking to leverage the mobile platform to get more users for your business is good but the success of app publishing would be determined by the user engagement and activity of your app. The number of apps on Play Store and iTunes are uncountable and that would keep on increasing. Most of the developers don't even bother to look for their app's performance after publishing it and it's like first making a ship and then letting it go without any direction.
If you have to make your app a success, you need to measure the right metrics and iterate and optimize your apps to your target goals. To do so, here are the top 10 metrics to measure user engagement in your mobile apps.
Read more: 10 Biggest Risks to Mobile Apps Security
1. Number of downloads
To achieve app success, the very first step is reaching a substantially large number of downloads. This is considered the most important metric for measuring the user engagement since the vital objective is to consolidate a broad user base.
Understanding and tracking the source of your app installs is also very important. From a marketing point of view, this will help you evaluate the effectiveness of your marketing efforts and advertising channels.
Tools you can use for this: Play Store and App Store reports
2. Total number of users (new and old)
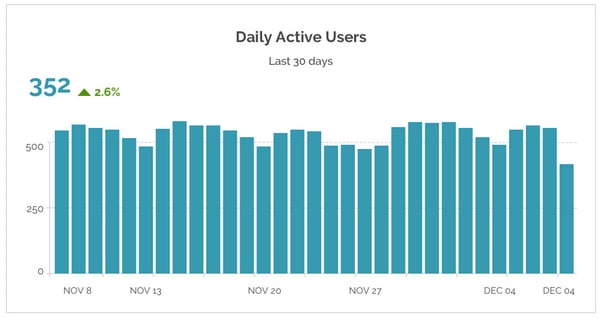
Tracking users for your mobile app is requisite to build better engagement with your users, like launching successful app marketing campaigns, tracking specific behavior and segmenting audiences. The numbers can be seen by Daily Active Users (DAUs), Weekly Active Users (WAUs) or Monthly Active Users (MAUs) and that can further be broken down by the device, age, demography, gender and many other. In addition to measuring engagement, getting these numbers helps planning for the growth of your app.
Tools you can use for this: Google Analytics, AWS Mobile Analytics, Fabric
3. Active app users

The active user metric is different from installation and downloads metric because it sees if users are actually using the app on a regular basis rather than just downloading it. These numbers are great for giving you a baseline understanding of your app’s growth. For a better understanding of your app usage, DAU (daily active users), Weekly Active Users (WAU), MAU (monthly active users) and stickiness (DAU/MAU) are considered few critical metrics. The number of active users on your app should be higher than the new user's number as this would indicate that there are recurring users in the app. Analytics tools have different criteria and sometimes ‘active user’ may revolve around the ‘session’, like for Google Analytics, which considers a user session only if the user opens and interacts with the app until 30 minutes of inactivity.
Stickiness is also an important factor and by knowing which features are making your app addictive or sticky, you will know the key parts of your app to drive engagement.
Tools you can use for this: Google Analytics, AWS Mobile Analytics, Fabric
4. Session interval
This is the time between two consecutive sessions of your app and shows the frequency at which user opens and uses the app. This could be a way to measure the addictiveness because it tells how soon or not soon users are returning to your app. This certainly quantifies the retention value and stickiness of your app, and also gives you direct inputs for improvements.
Tools you can use for this: Google Analytics, AWS Mobile Analytics
5. Session length
Session length is the measure of the time period between the opening and closing of an app by the user, or in between the first activity and the last activity that he performs. More engagement would mean longer session durations. Also apart from the session length and the number of sessions per day, developers can identify those customers who spend a lot of time on the app just to improve the experience for less-engaged users.
Tools you can use for this: Google Analytics, AWS Mobile Analytics, Fabric
6. Time in the app
This defines the time a user stays on your app. Time in the app is a function of session frequency and session length which tells how long users are staying in your app on a daily, weekly or monthly basis and similar to other mentioned metrics this also helps increase the understanding of the user behavior and app usage patterns.
Few questions you should ask yourself when users are not opening the app and to increase user engagement; “Are user’s screen flow similar?”, “Why are they using the app for long or short periods of time?” or “Are they just searching or also buying more?”.
Tools you can use for this: Google Analytics, AWS Mobile Analytics, Fabric
7. Screen flow
A screen flow analysis can be used to track a total number of visits per screen, exits by the screen and the navigation flow between screens. A screen flow helps visualize the actions of your app’s users. This analysis would help you get insights on what users did on any particular screen and where they went after that. By looking at the navigation pattern of your users, you surely will get a clear sense of drop off screens, conversion road bumps and problem areas. With all this data in hand, you can create in-app marketing campaigns to get back dropped users and implement redesigns to create clearer funnels.
Tools you can use for this: Google Analytics, Mixpanel, Localytics
8. Retention

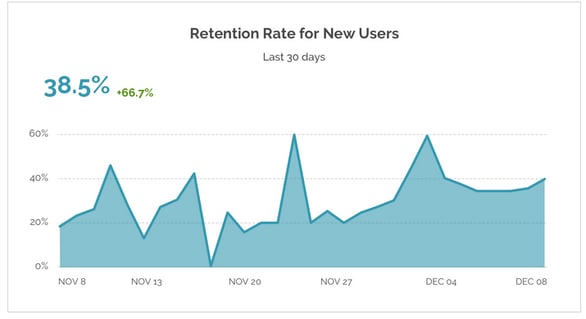
The percentage of users that return to your app in last 30 days defines retention of the app. In fact, stickiness and retention go together to see how addicted users are to your app. By making some key changes to your onboarding flow after analyzing the behavior of both who retain and who not, you can ultimately increase the retention rate. Retention, or “cohort,” tracking highlights your most valuable- and engaged- users, building better targeting opportunities and customization of the app experience. It is seen that apps retain only 40% of their initial users after a period of 30 days, on an average. As the costs for install are rising, it's better to focus on retaining rather than acquiring.
Churn is another important metric that should be looked upon. It is that percent of users who close the app and never come back. It is just the opposite of retention rate. The drop-off in retention would tell where your users are churning. As per Flurry data, Andriod and iOS apps have a retention of 4% and hence they lose 96% users, so basically their monthly churn rate is 8% and you should target better than this for your app.
Tools you can use for this: AWS Mobile Analytics, Fabric
9. Conversion
If there are any actionable features in your app like signing up, making a transaction, filling a form, giving a review, etc you’ll want to measure how many users are getting converted to goal target. Thus conversion rate is defined as the percentage of users who perform a set of goals or a specific goal that you want them to perform in your app. By calculating conversion rate at each step in your funneled data, you may know where the users are dropping off. For app tracking and conversion, tools like Apsalar and AppsFlyer can be used.
Tools you can use for this: AWS Mobile Analytics,Google Analytics, Fabric (all using custom events), Branch (referrals)
10. Lifetime value (LTV)

Last but not the least, lifetime value is THE revenue metric for looking at how well you are monetizing. It is the total revenue that you earn from a user before they stop using your app. LTV helps to find out the profit your users can generate and also predict the amount of money your app would make in the future.
LTV can be measured through a monthly average by user, which evaluates how much money that user can generate over a period of time. Also, there are formulas that can show the average revenue per customer.
Tools you can use for this: Whatever your analytics package is
Read more: User Retention in Mobile: 7 Ways to Engage and Retain App Users
Optimizing and measuring for the correct engagement metrics is the key to keeping and attaining users. If you want to know more about how to measure user engagement in your mobile app or how to make your app better based on the results, please get in touch.

Market like a Pro: Why Measure User Engagement with App Analytics?
In order to understand the number of people who download your app and how much business you draw from it, you need to have a version of app...

1 min read
7 Mobile App Metrics to Track the Real Profits Made by an App
Mobile apps and games are an ever-evolving market. With rapid innovations, increasing market penetration and growing usability smartphones have...


