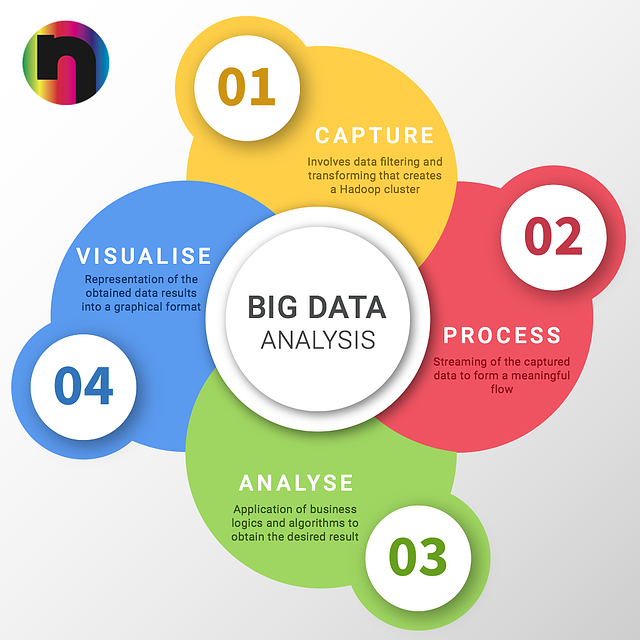

Today’s data visualization tools stretch beyond the traditional spreadsheets or Excel charts and graphs. In an ever-growing business landscape that generates increasing amounts of data, it’s important to intuitively format and display information in order to make optimal decisions. For this reason, data visualization has become a standard practice for business intelligence strategies, and it serves as a vital feature in a company’s success.
A recent Experian report noted that 95 percent of US organizations say they use data to power important business decisions and 84 percent believe data is an important component in creating a successful business strategy. Although the importance of data is indeed recognized, large amounts of it can be overwhelming and difficult to process, especially when unorganized or displayed in unintuitive manners. By alleviating such issues, visualization aims to increase the accessibility of conducting data analysis, providing insight and decision-making benefits to businesses that effectively employ it.
Making sense of your data
As one processes data to inform business insights and decisions, it may be hard to consider all the nuance, especially when there is a lot of information to parse. At its core, visualization aims to package datasets, piles of numbers, or quantifiable aspects of word documents into organized, easier to read formats.
Whether it’s in the form of a chart, a graph, live data configuration, or 3D model, visualization tools assist in conveying the meaning of the underlying information in more digestible and accessible manners. Repacking information into conducive forms allows companies to identify previously obscured associations, trends, or characteristics in the data they capture. Such realizations may inform decisions or processes across the business, including operations, finance, customer-targeting, sales, market trend analysis, and internal employee management.
Generating insights
Collecting large amounts of data fuels the ability to conduct powerful analysis that helps gain additional understanding and visibility. Though, it can also be incredibly hard to derive insights when there may be millions of individual points to work with. This is especially the case when the information pulls from multiple different disaggregated, and potentially disorganized, sources. With so much to take in at once, it can be hard to see the forest for the trees.
Utilizing visuals to repackage and parse such data allows businesses to combine all those tiny puzzle pieces into clearer, big pictures. From there, it is easier to identify trends, relationships, and correlations regarding variables, instances of conditions, and different segments of data. Visualization of such aspects serves as a conducive format for internalization by the visual cortex and data processing centers of the brain, as they can more easily derive meaning when things are laid out visibly.
Hold the attention
Visualizing data not only helps organizations derive insights, but it also provides a means to intuitively express them for impact. Documents, spreadsheets, and backend databases serve the useful and necessary purpose of storing large amounts of data, but without visualizing their meaning, they remain displeasing or completely unintelligible to the eye. Keeping data in these formats may silo insights or lower the level of interest from potential viewers. Converting portions of data from such repositories into visuals helps to express their meaning while benefiting from the use of colors, pictures, or even interactive elements as they tell the brain a story.
Visual displays of information helps one to process what they are seeing, while limiting the staring at long strings of numbers, words, or figures, which can be exhausting to the eyes. When the data tells a more accessible story, it is also more likely to grab one’s attention in an enticing, or even adventurous, manner. With their interest captured, viewers can more fully engage with the information and meaning it aims to convey.
Strategizing and building campaigns
Once the data has been organized and visualized into a digestible format, businesses can then communicate and act on it in helping drive their decision making. After all, internalizing the meaning of the data is important and cannot be overlooked, but it only constitutes the first step of the larger plan, which is to make better decisions based on it.
With the trends and relationships identified within the collected information, businesses equip themselves to tailor operations, marketing, production development, or other plans to optimize results. Effective visualization augments the value of data as it guides firms through these processes with accessible, data-driven evidence. Whether put to use to better project or increase ROI of projects, increase website traffic, raise productivity, or better sell and market their product, data visualization serves as a tool further arming businesses to reach their goals.

Benefits of using Big Data in Education
Data alone is nothing but the deep data analyzed can become a treasure in the form of reliable information, which can make a difference in the...

What is the Google Data Studio
Have you been wondering when Google will release a dashboard that you can use to communicate the success of campaigns with your customers? Look no...


